The Analytics dashboard gives you a live view of how your organisation's inspections are tracking, by inspection type, status, inspector, suburb and device. It works alongside the Monthly Schedule, which emails a designated manager a CSV summary of the previous month's inspections on the 1st of each month.
Note: Analytics is in the Admin section of the PIM Cloud Dashboard sidebar. A Manager account role is required to view it. |
Contents
Benefits of Analytics
- See workload at a glance – check how many inspections are scheduled, in progress or inspected without exporting a report.
- Track your team – compare how many inspections each inspector has completed and how many are still outstanding.
- Spot patterns – see which suburbs and inspection types make up most of your work.
- Understand device use – see which devices each inspector is using in the field.
- Report without the admin – turn on the Monthly Schedule and a summary arrives in your inbox every month.
Accessing Analytics
Log in to the PIM Cloud Dashboard, then select Analytics under Admin in the left sidebar.
Filtering the Charts
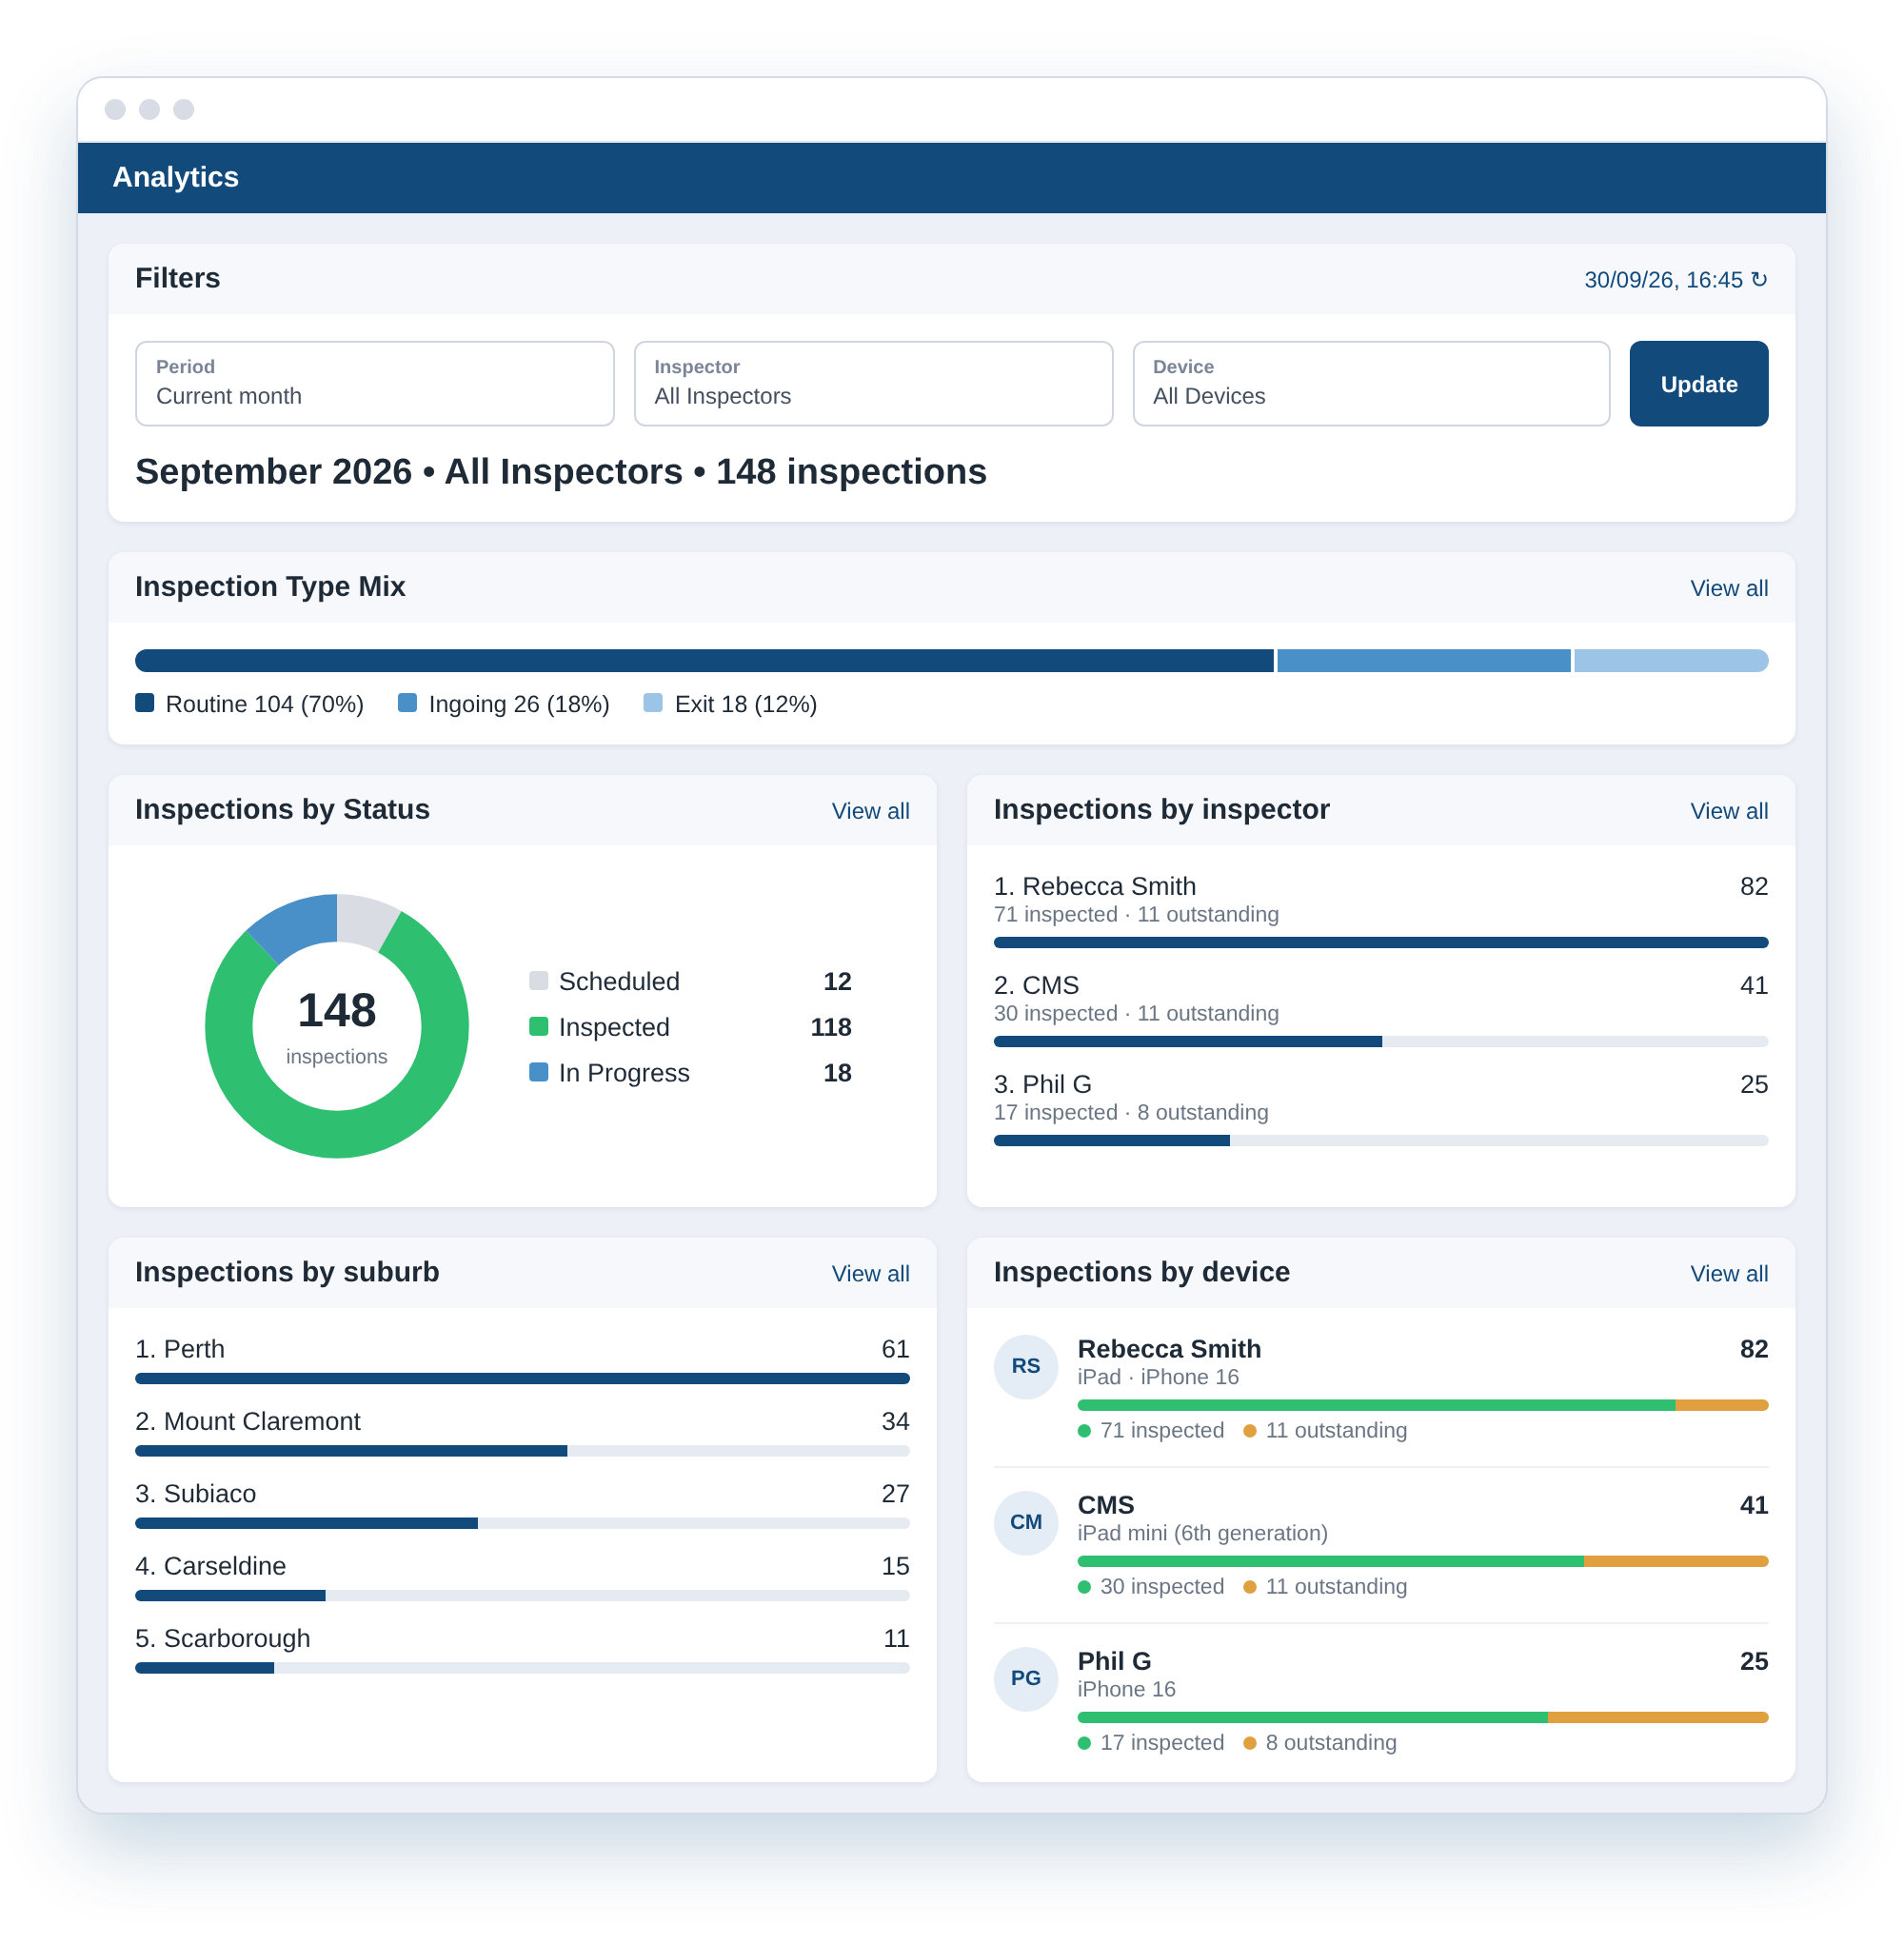
Use the Filters panel at the top of the page to choose what the charts show, then tap Update:
- Period – Current month, Previous month, Previous quarter, Last 6 months or Last 12 months
- Inspector – All Inspectors, or a single inspector
- Device – All Devices, or a single device
The total number of inspections for your selection is shown below the filters. The date and time in the top-right corner of the panel shows when the data was last refreshed. Tap the refresh icon beside it to reload.
Dashboard Sections
The dashboard is made up of the sections below. Each section has a View all link that opens the full list behind the chart.
Inspection Type Mix

A single bar showing how your inspections are split by type, such as Routine and Ingoing. The legend below the bar shows the count and percentage for each type, so you can see the balance of your team's work at a glance.
Inspections by Status
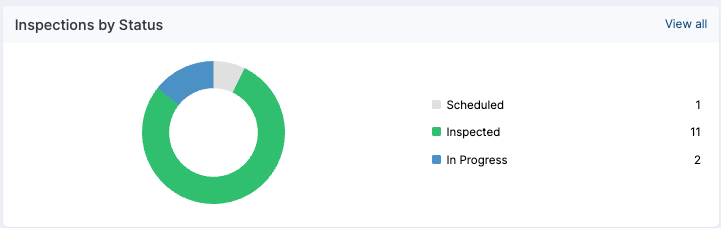
A donut chart showing where your inspections are up to. The legend lists the count for each status:
- Scheduled – booked but not yet started
- In Progress – started on a device but not yet finished
- Inspected – finished in the field
Inspections by Inspector
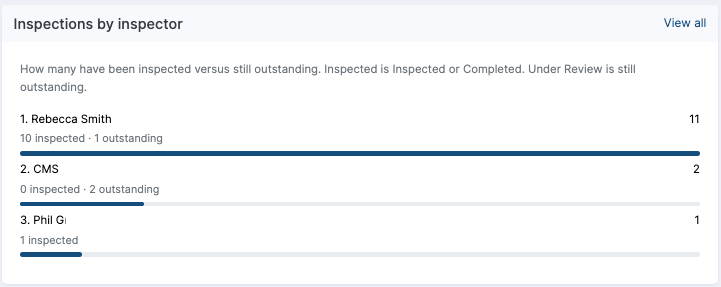
A ranked list of inspectors by the number of inspections assigned to them. Under each name you'll see how many have been inspected and how many are still outstanding, making it easy to see who has work still to finish.
Note: Inspected includes inspections marked Inspected or Completed. Inspections Under Review are counted as outstanding. |
Inspections by Suburb
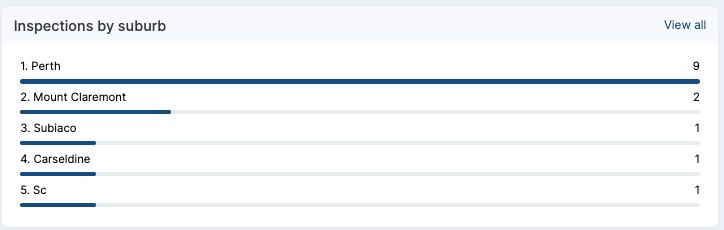
A ranked list of the suburbs where your inspections took place, with the busiest suburb at the top. Use it to see where your team is spending most of its time and to help plan inspection runs.
Inspections by Device
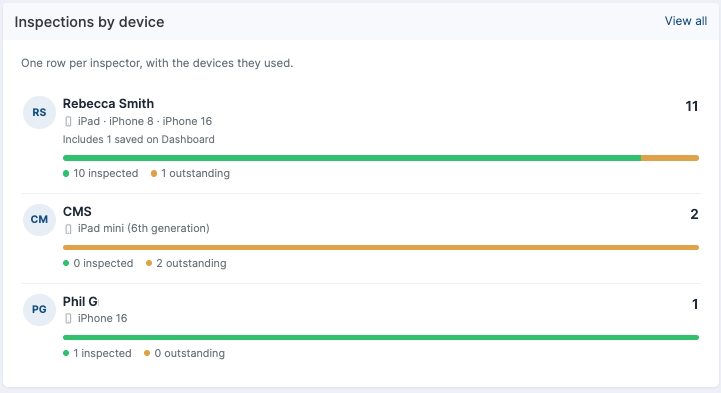
One row per inspector, showing the total number of inspections and the devices they used (for example iPad, iPhone 16 or iPad mini). Each row includes:
- A coloured bar showing inspected (green) against outstanding (orange)
- A count of any inspections saved on the Dashboard rather than on a device
This helps you check which devices are in use across your team, and spot anyone still using an older device.
Monthly Schedule
If you'd rather receive a summary than check the dashboard, turn on the Monthly Schedule. A CSV summary of all organisation inspections completed in the previous calendar month is then emailed to that manager on the 1st of each month.
Tap your avatar in the top-right corner and select Update User Details. Tap Edit Details, turn on Enable Monthly Schedule, then tap Save Details.
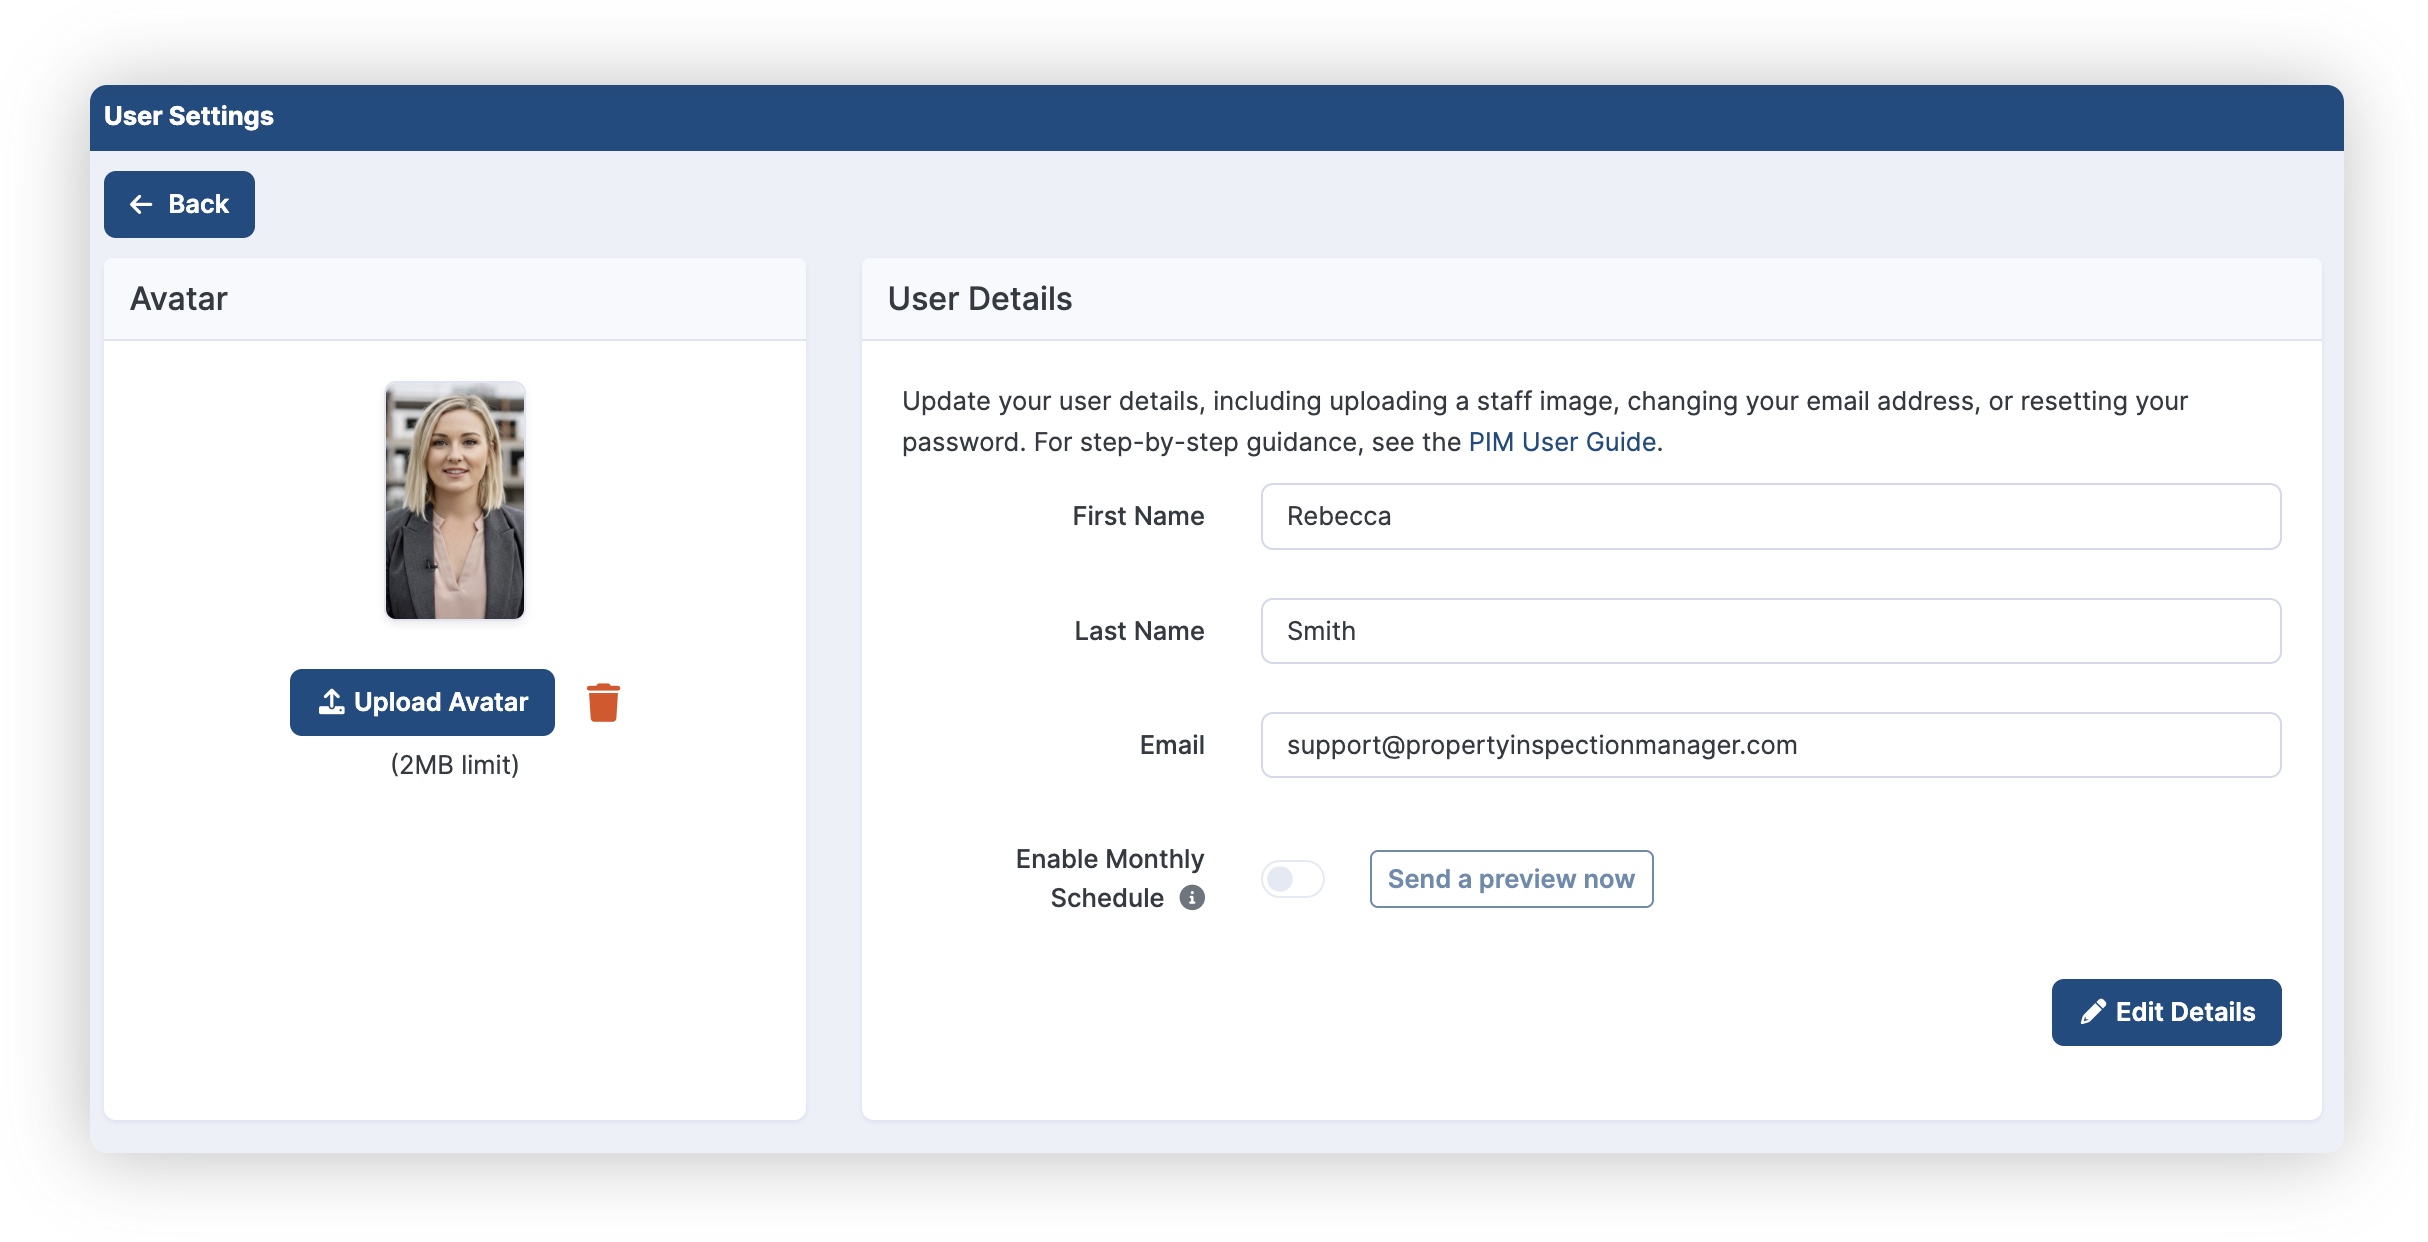
Tip: Tap Send a preview now to receive the report straight away. That way you can check it reaches the right inbox before the first scheduled send. |
For full step-by-step instructions, see Managing the Monthly Inspection Schedule.
If you need any help, please contact PIM Support and we’ll be glad to assist.
Was this article helpful?
That’s Great!
Thank you for your feedback
Sorry! We couldn't be helpful
Thank you for your feedback
Feedback sent
We appreciate your effort and will try to fix the article